Results - CDO_complete

Calculations ended successfully.

Input parameters

Project:CDO_complete
High resolution diffraction limits:2.00 Å, 1.90 Å, 1.80 Å, 1.70 Å, 1.60 Å, 1.50 Å, 1.42 Å
Initial structure model:2B5H_edit_refmac1.pdb
Merged diffraction data:CDO_R.mtz
Unmerged diffraction data:XDS_ASCII.HKL
Number of pre-refinement cycles that will be performed before the paired refinement protocol:20
Complete cross-validation is performed.(across 20 free reflection sets)
Modification of the input structure model:
  • Reset B-factors to the mean value
  • Randomize coordinates with the given mean error value: 0.25

Run details and program versions

Working directory:/public/pairef_datasets/publication_examples/3-3_CDO/pairef_CDO_complete
Run date and time:2020-05-26 13:58:54
user@host:maly@localhost
PAIREF version:1.1.0
REFMAC5 version:5.8.0258
Python version and executable:2.7.15 /protein2/phenix/phenix-1.16-3546/build/../conda_base/bin/python2.7
matplotlib version:2.2.3

Overall values

R-values
Raw data: CDO_complete_R-values.csv
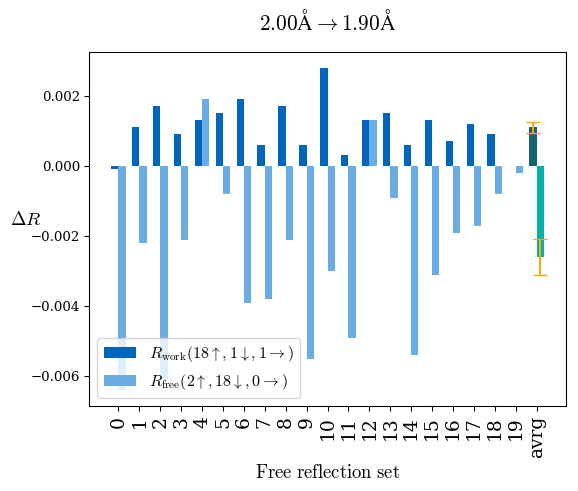
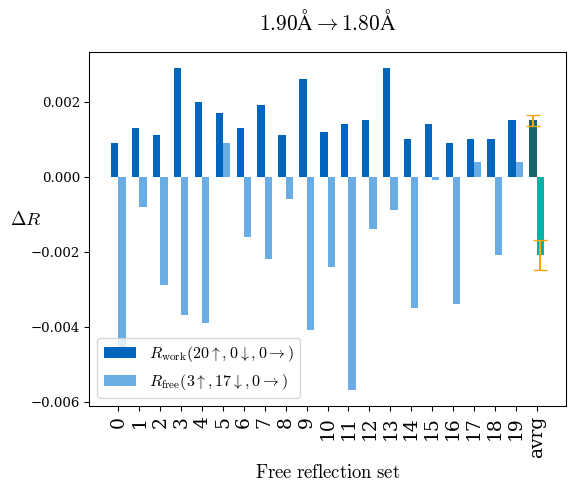
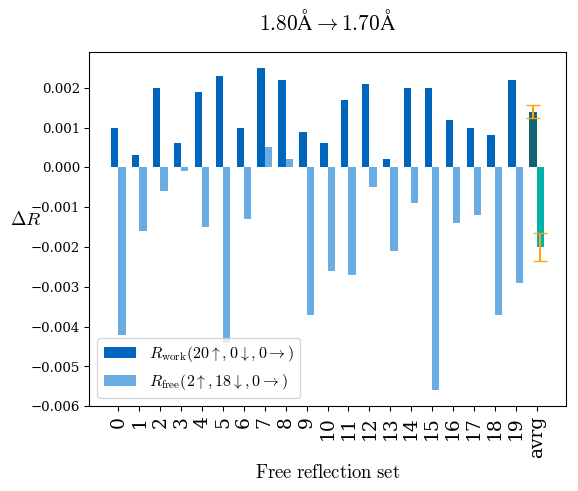
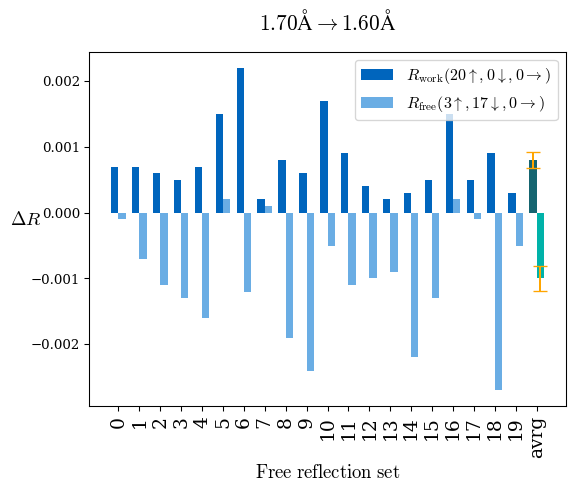
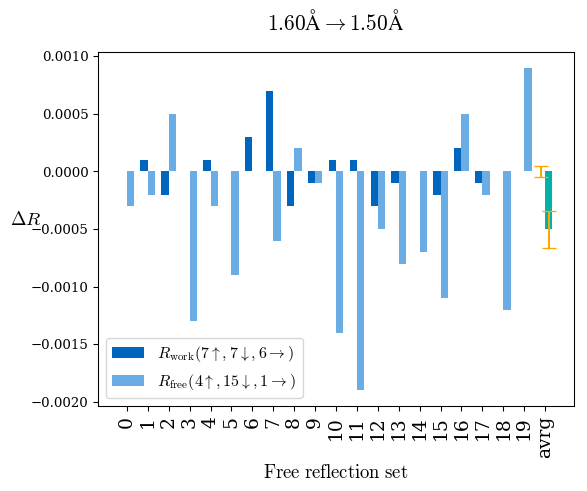
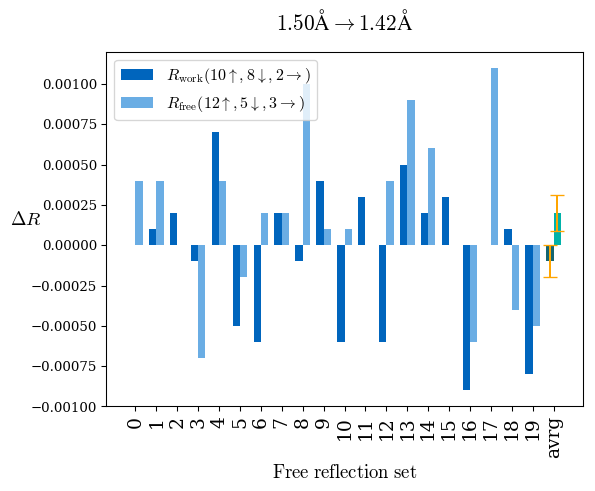
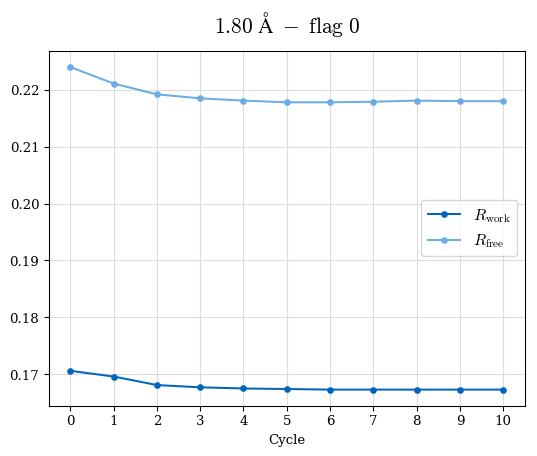
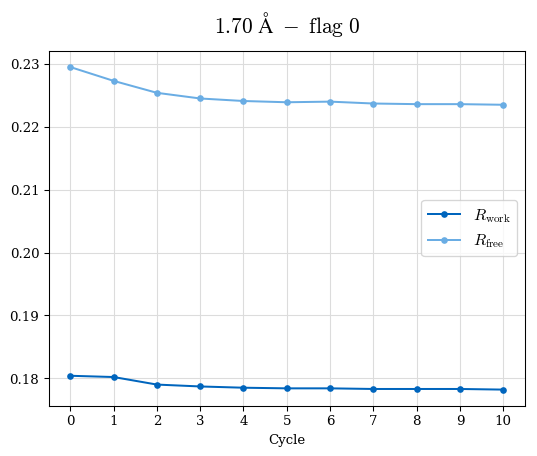
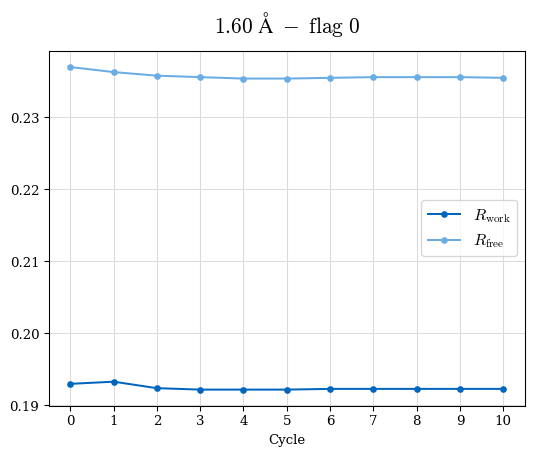
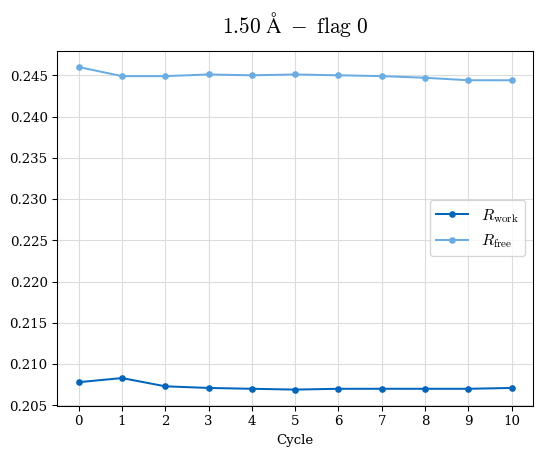
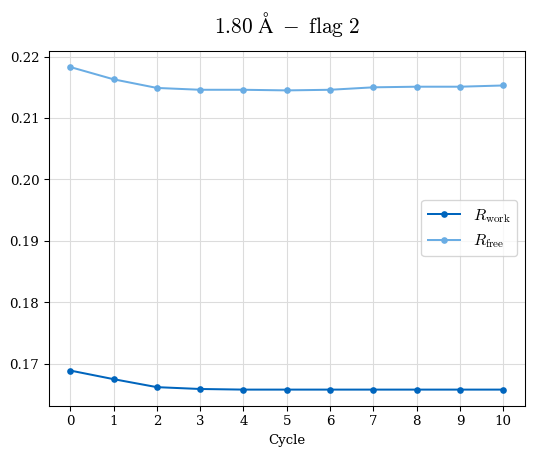
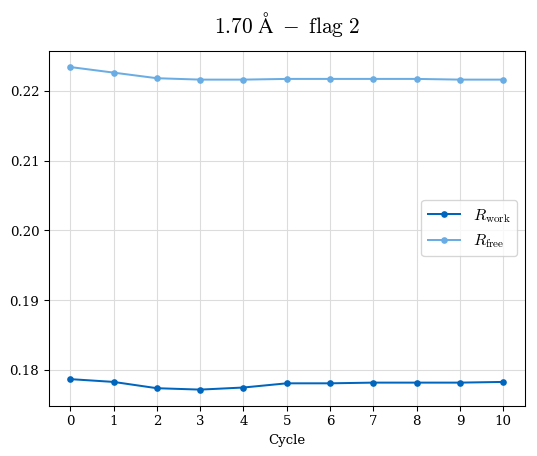
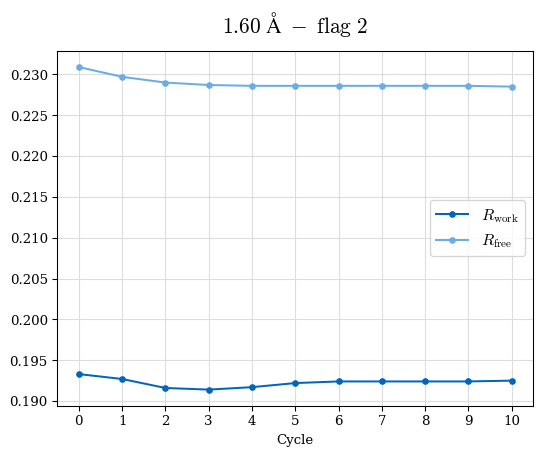
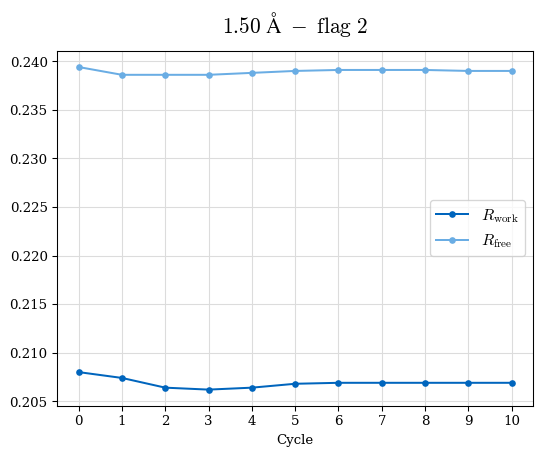
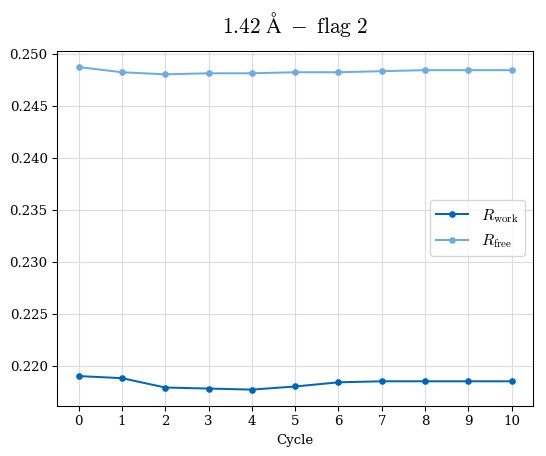
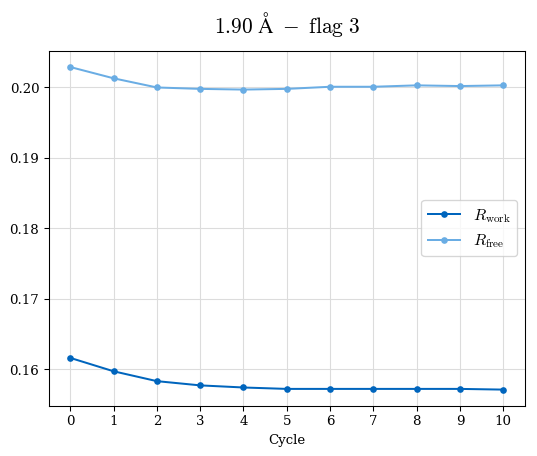
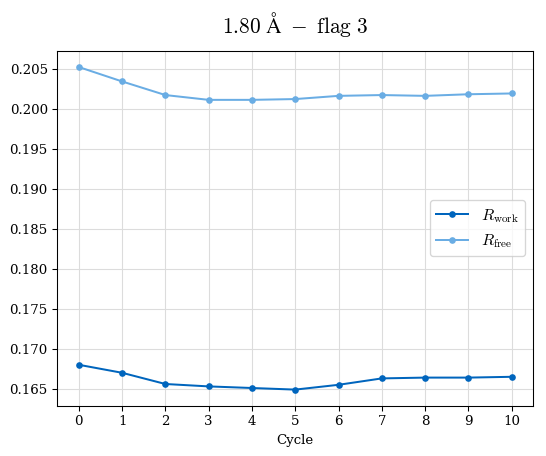
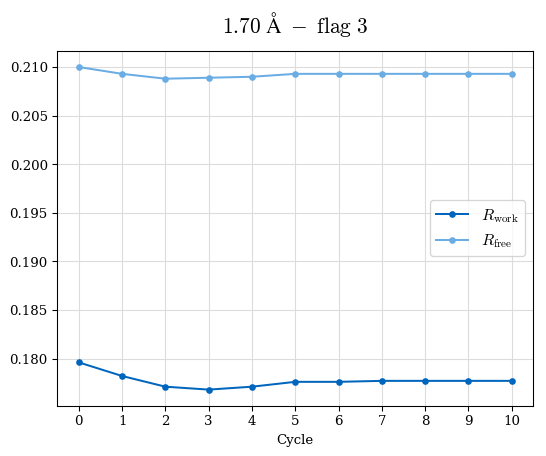
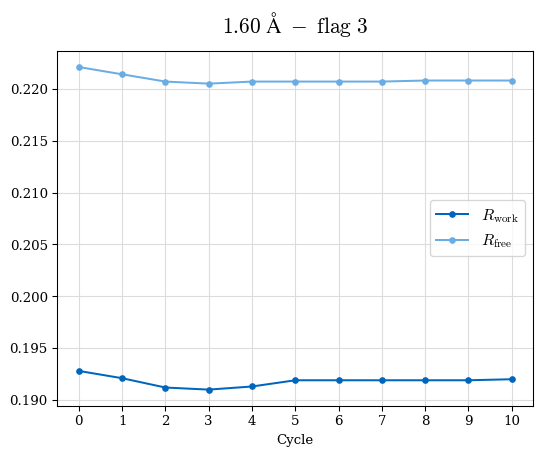
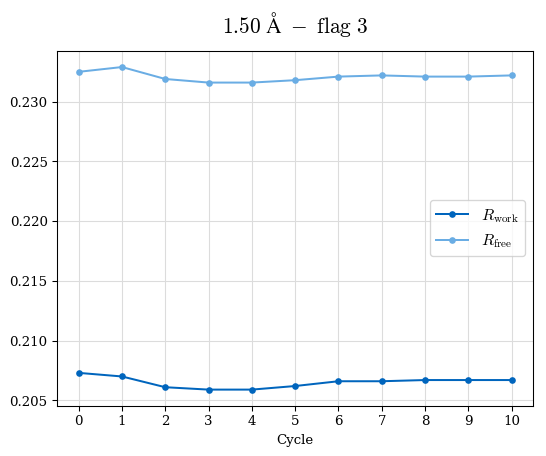
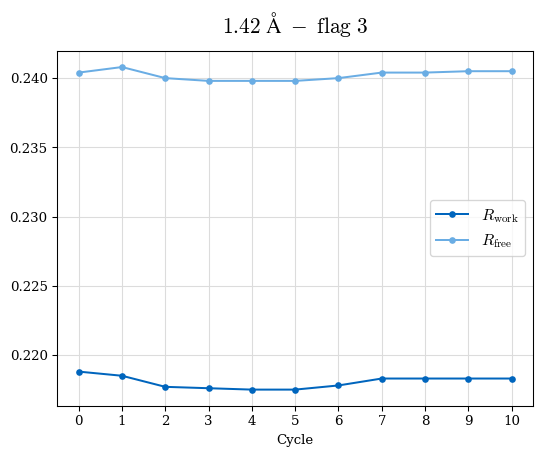
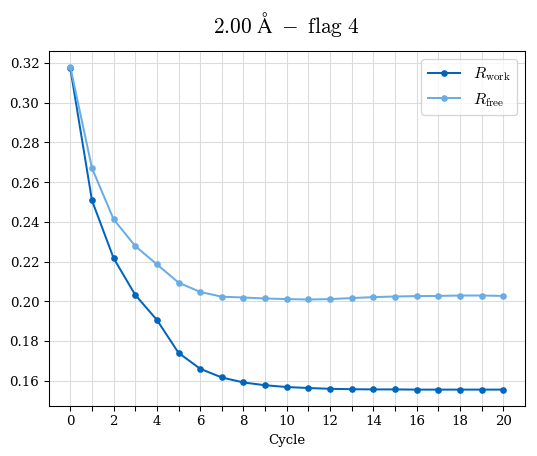
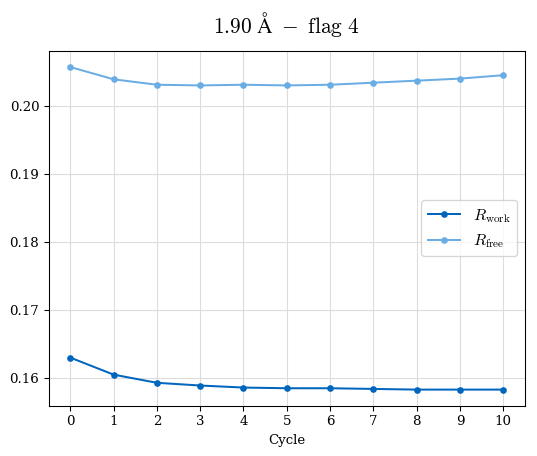
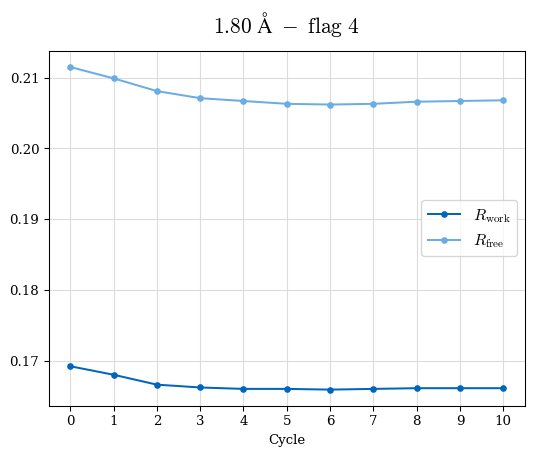
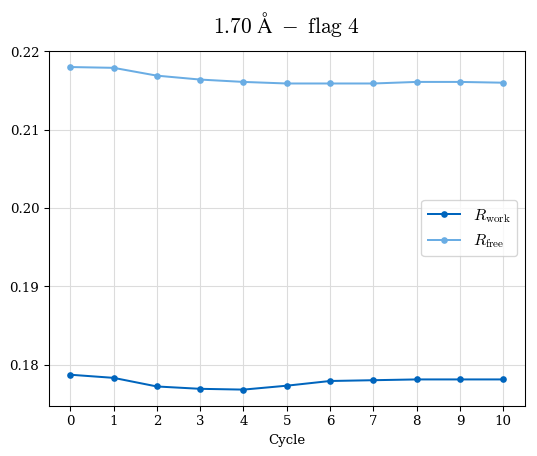
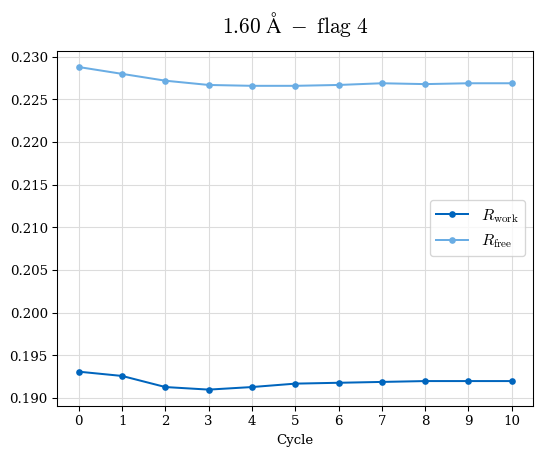
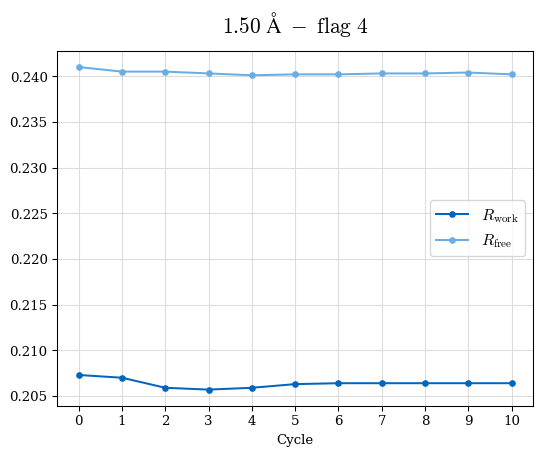
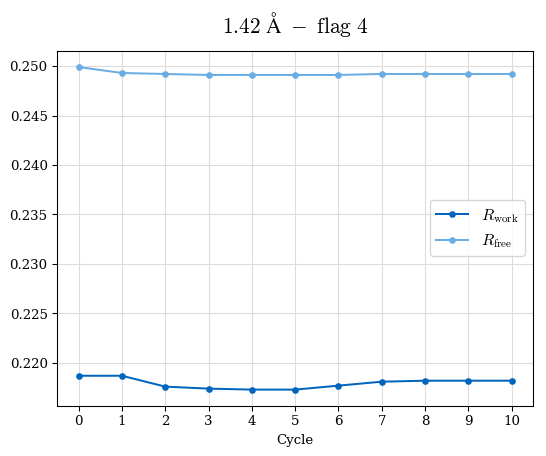
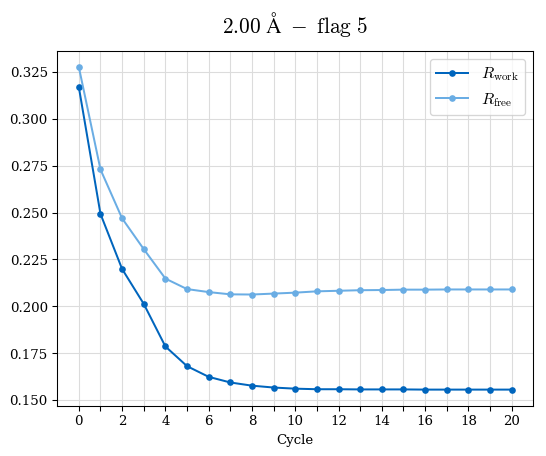
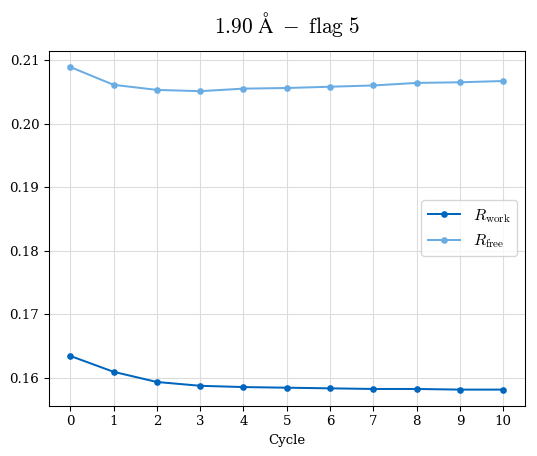
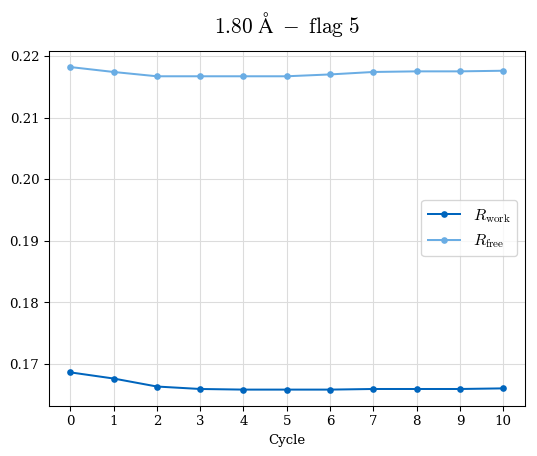
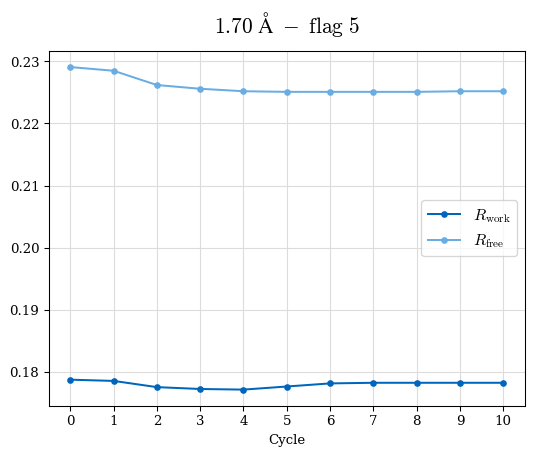
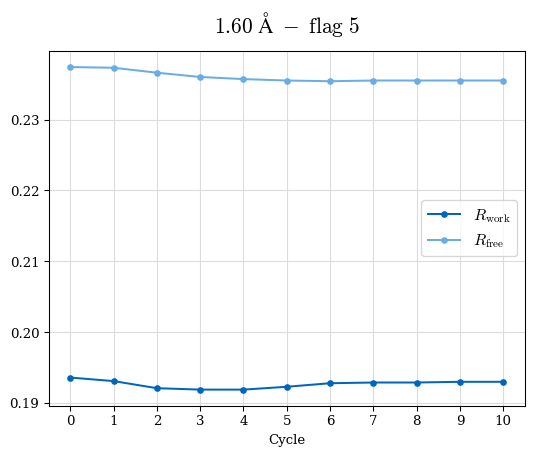
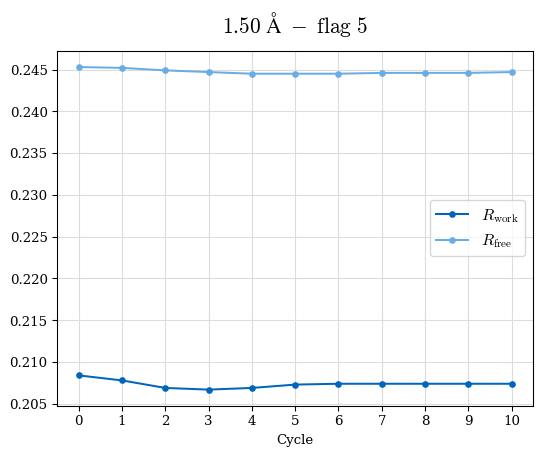
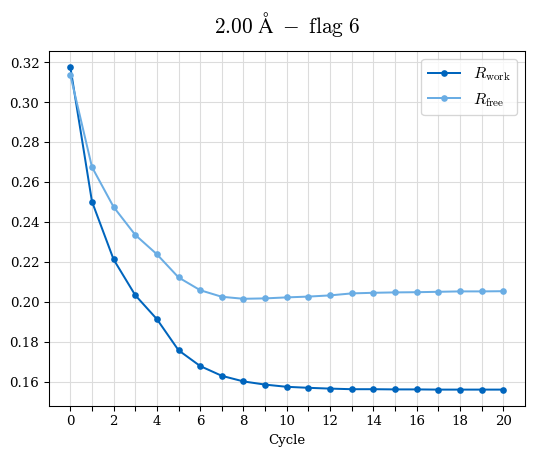
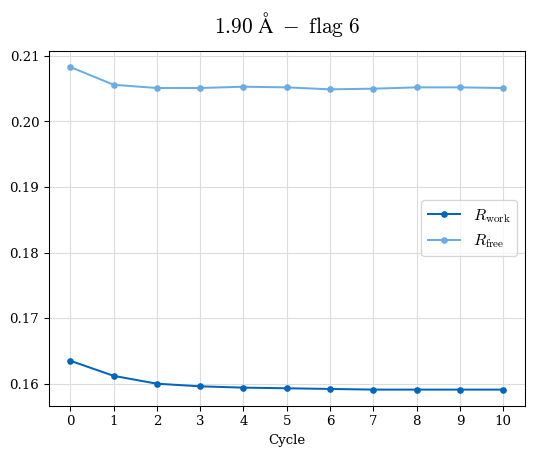
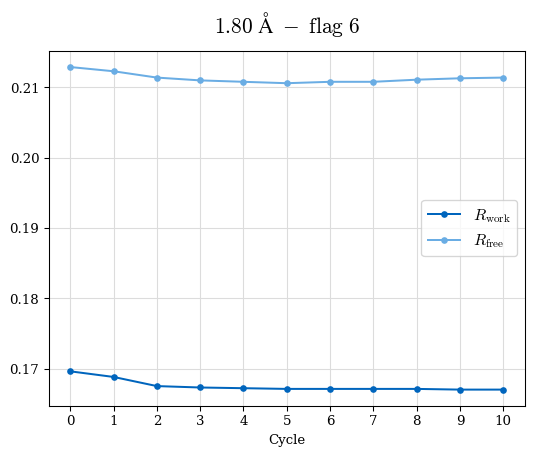
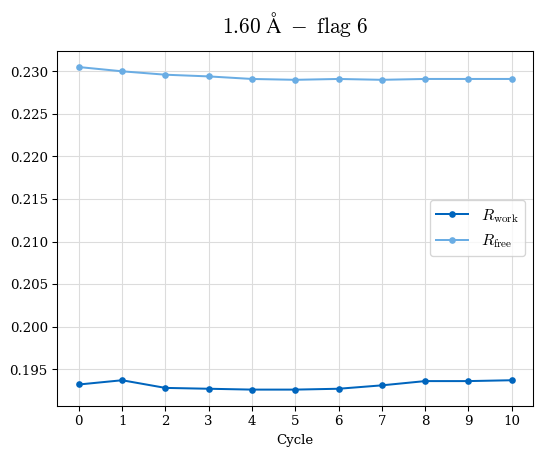
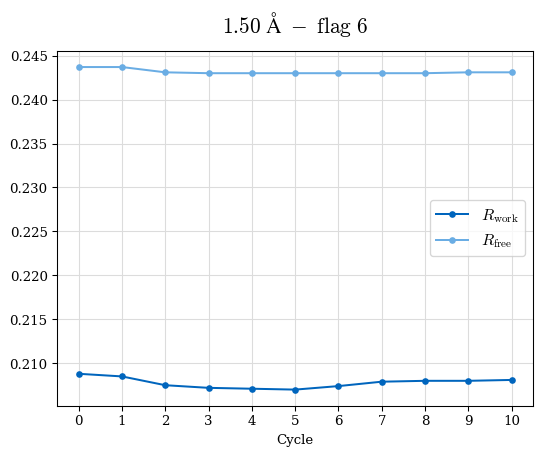
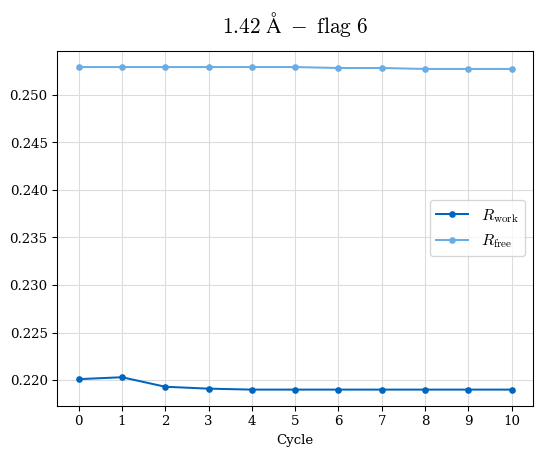
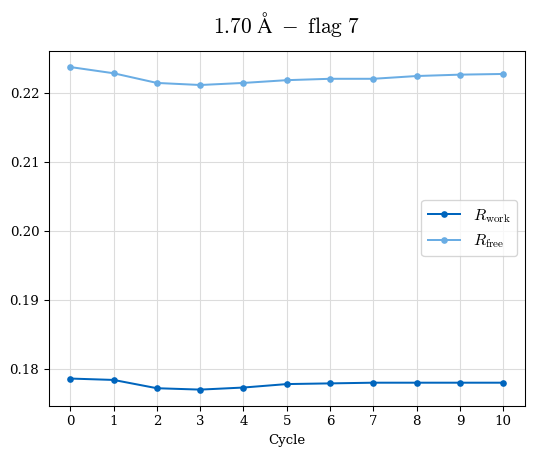
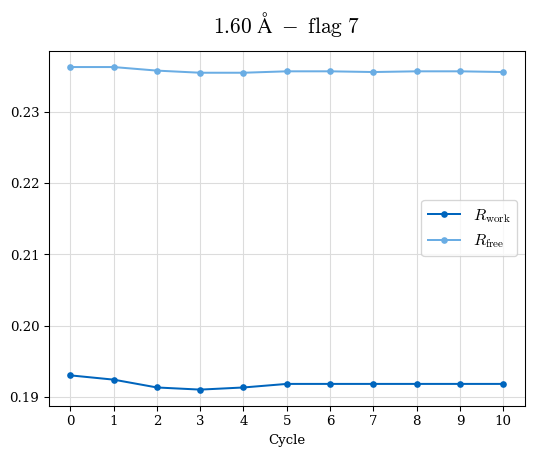
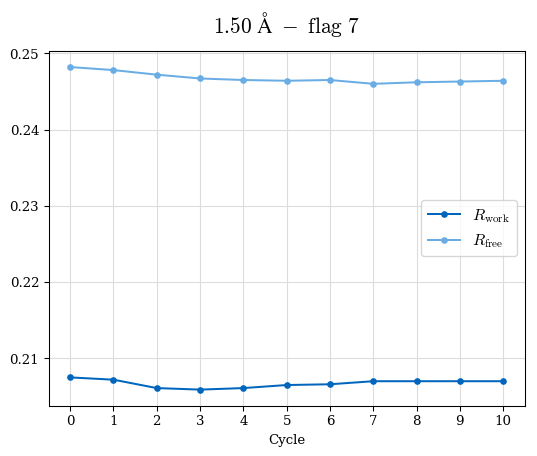
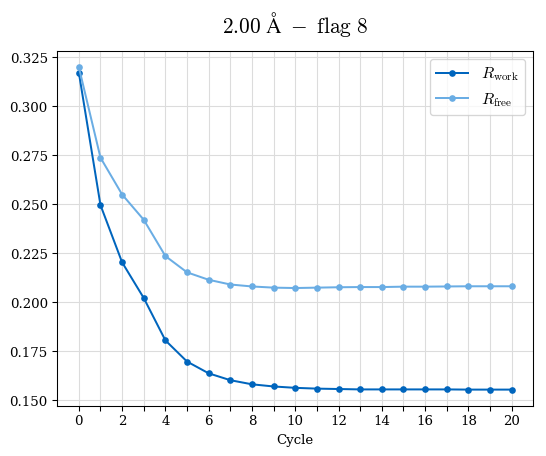
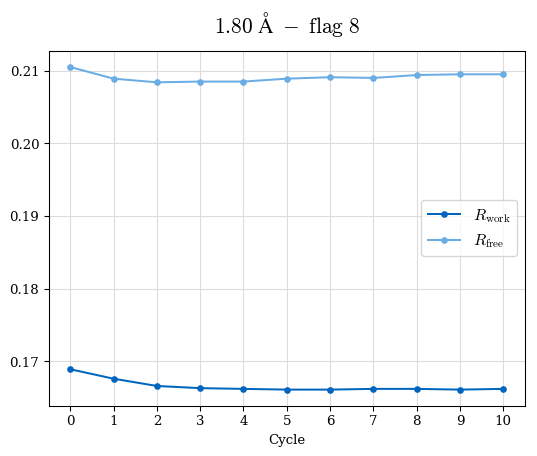
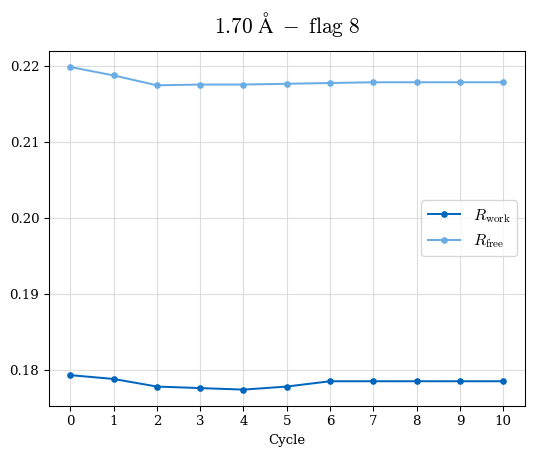
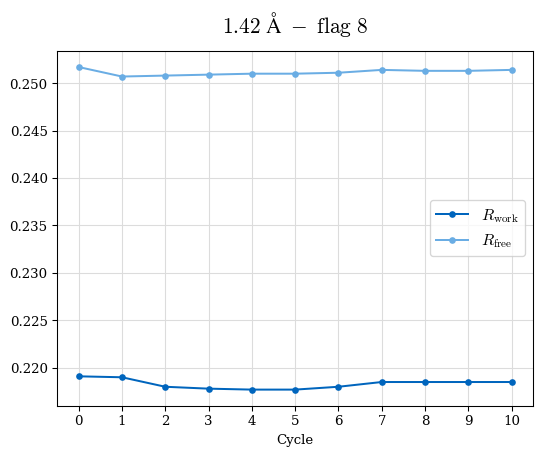
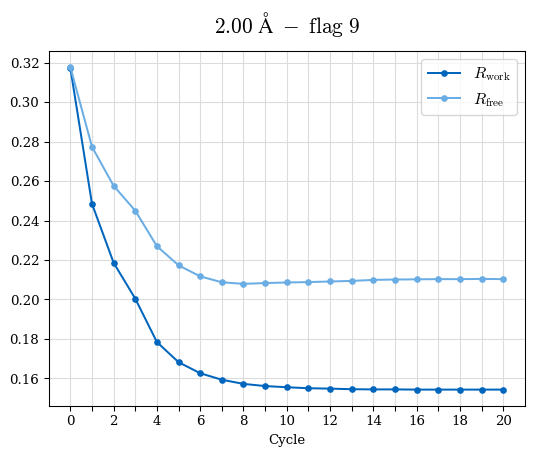
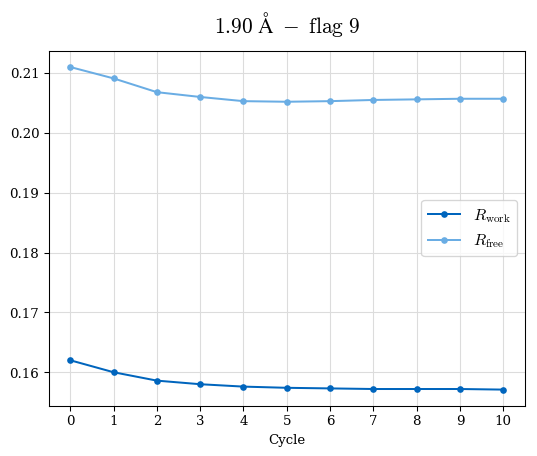
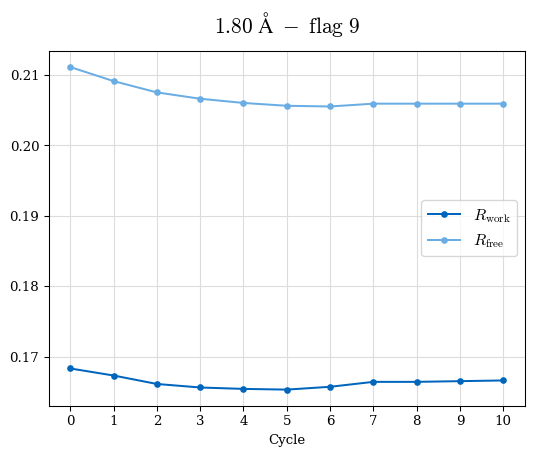
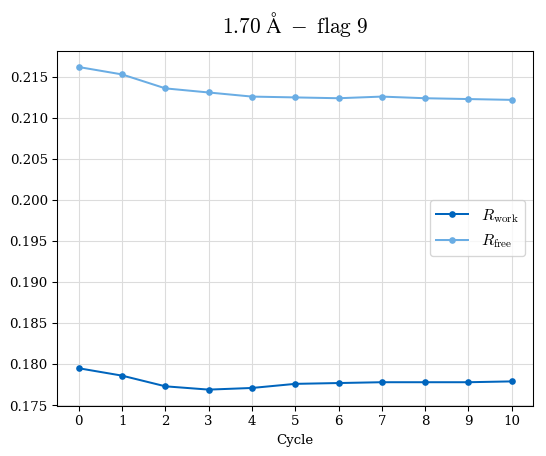
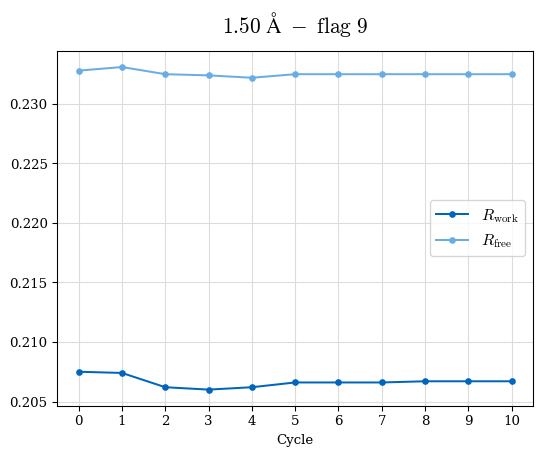
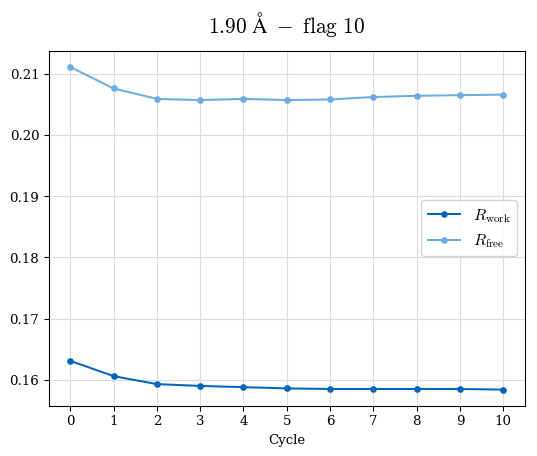
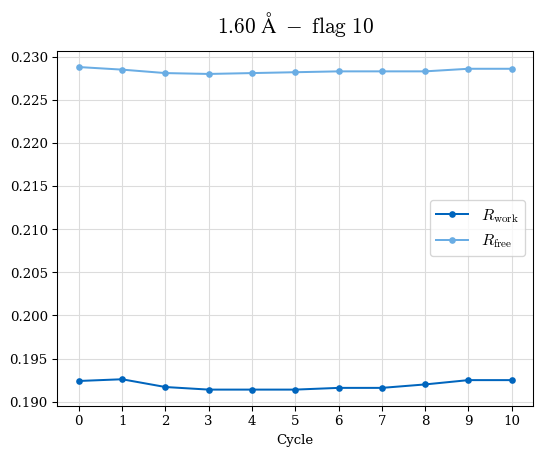
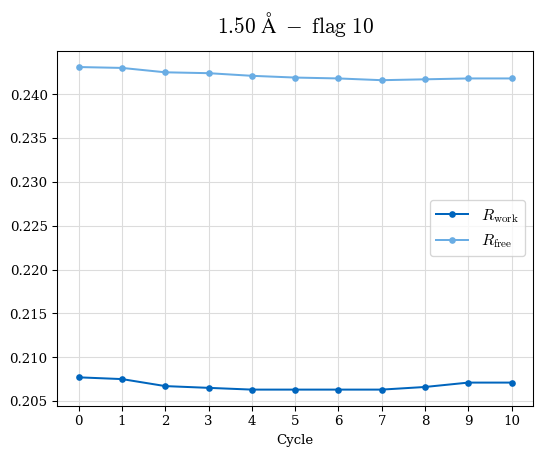
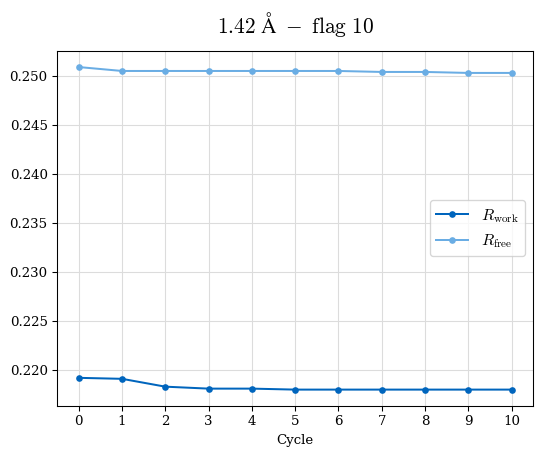
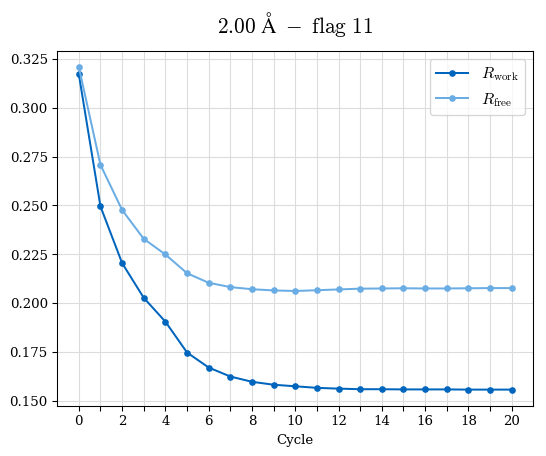
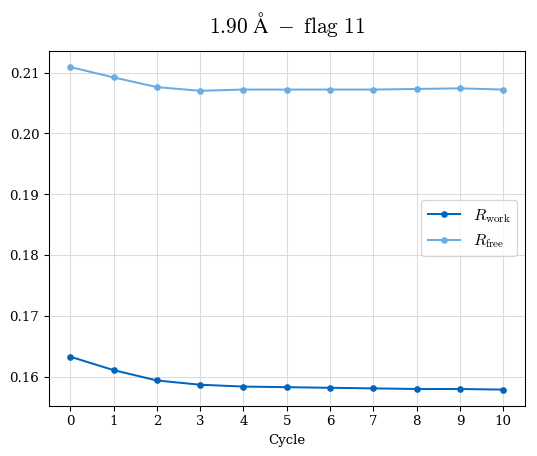
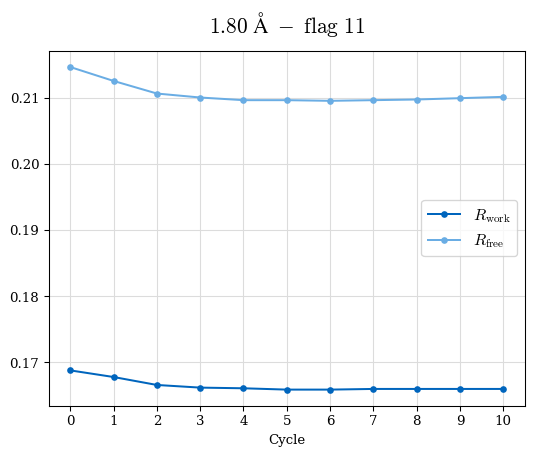
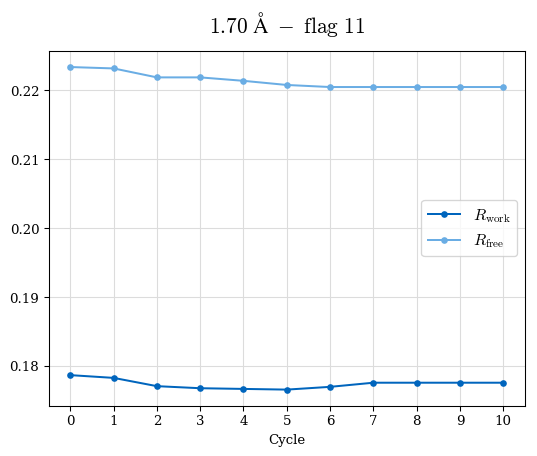
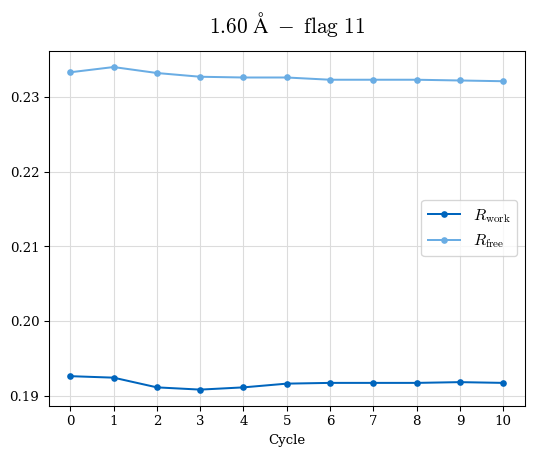
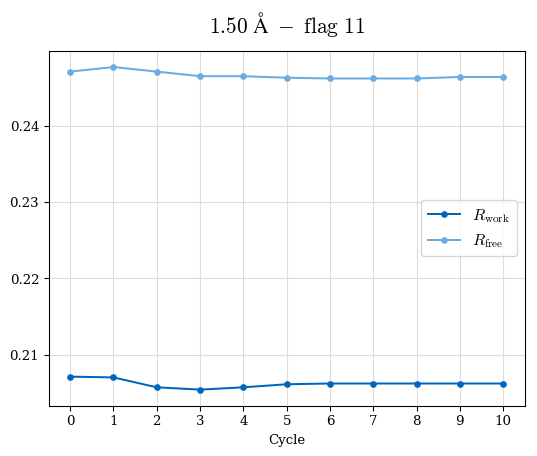
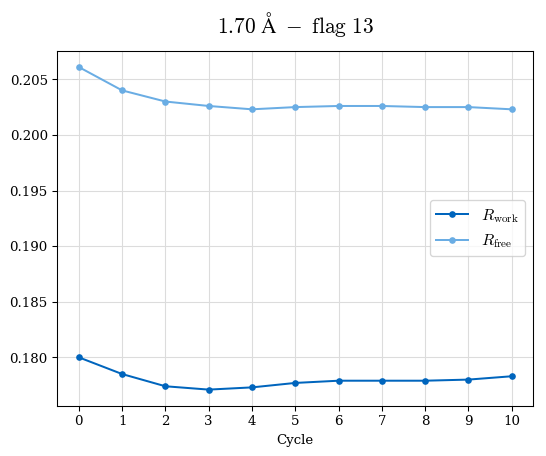
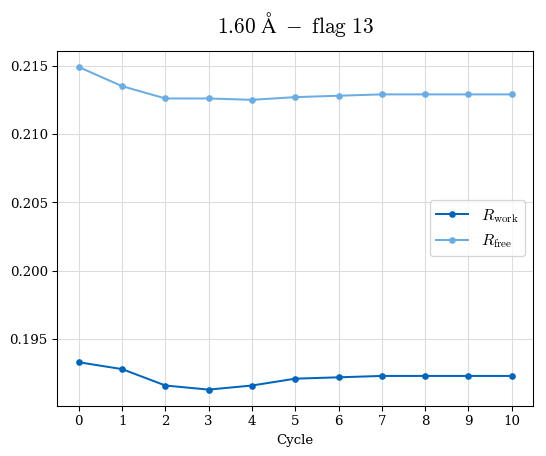
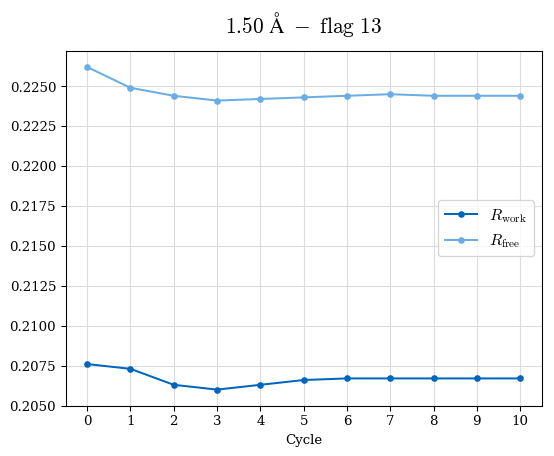
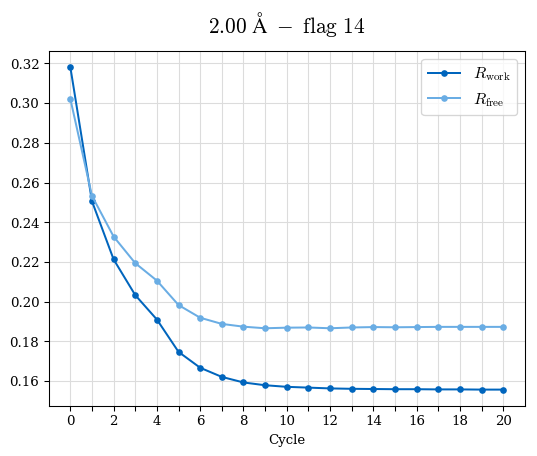
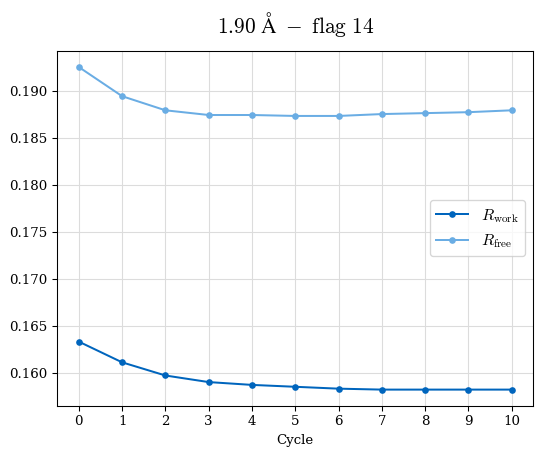
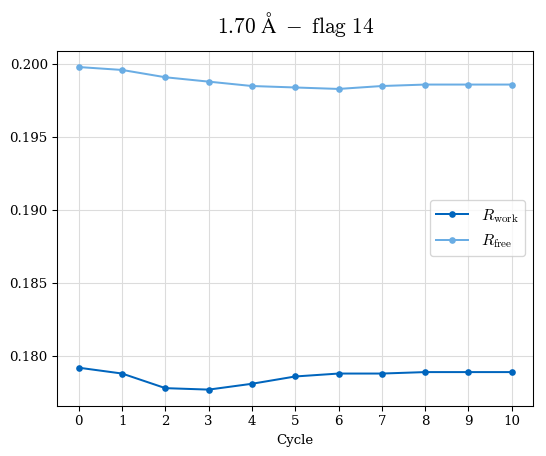
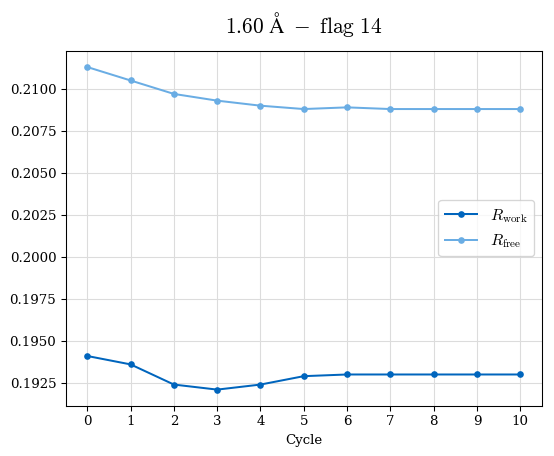
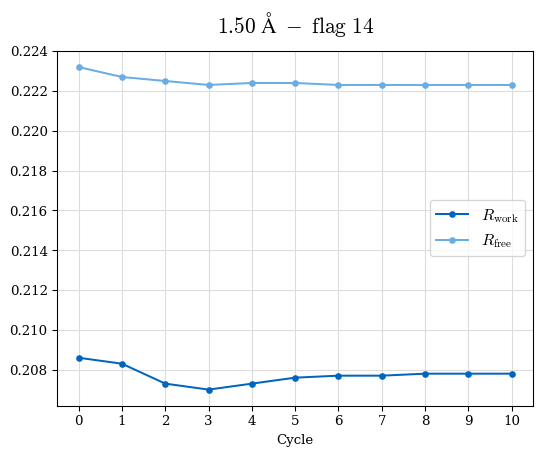
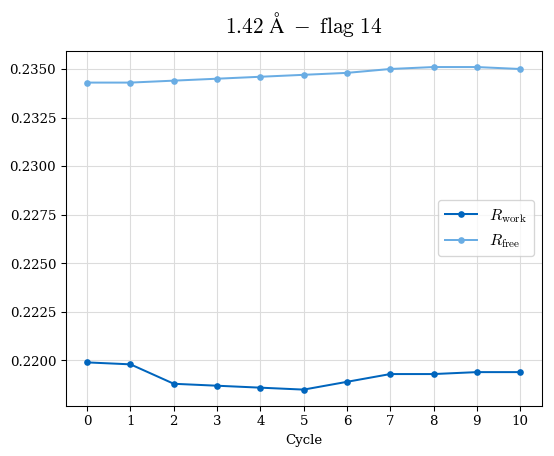
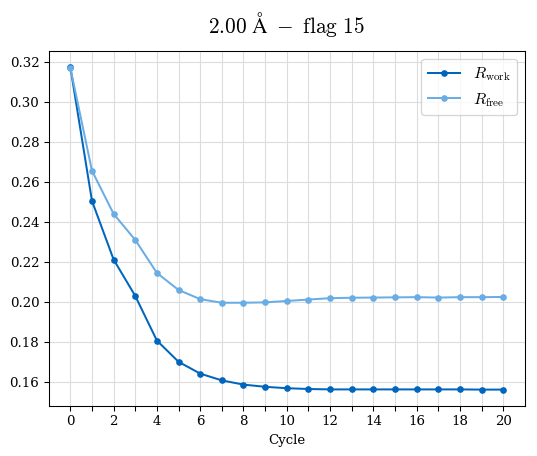
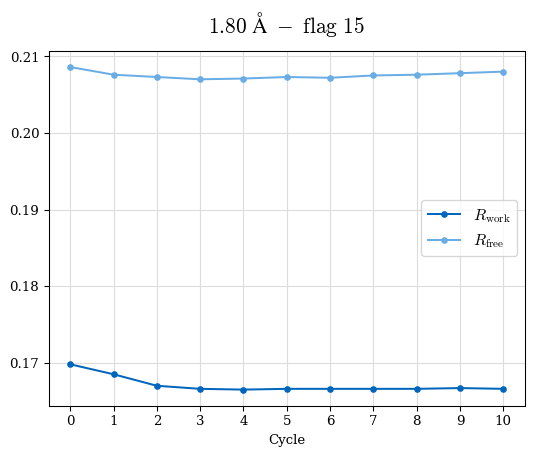
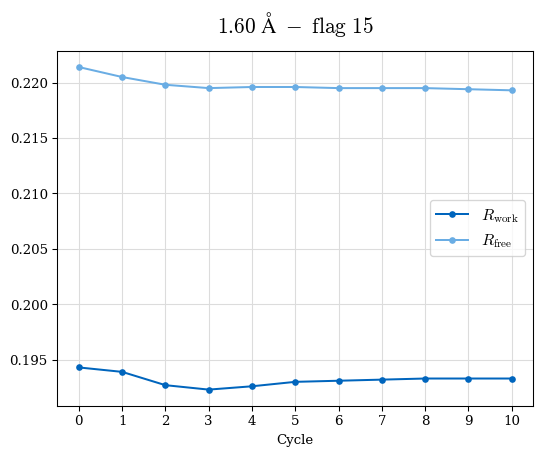
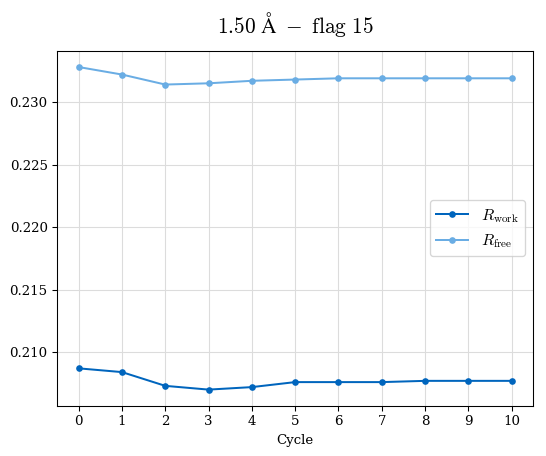
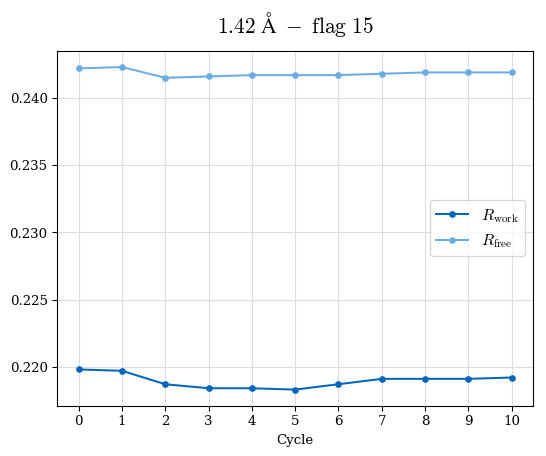
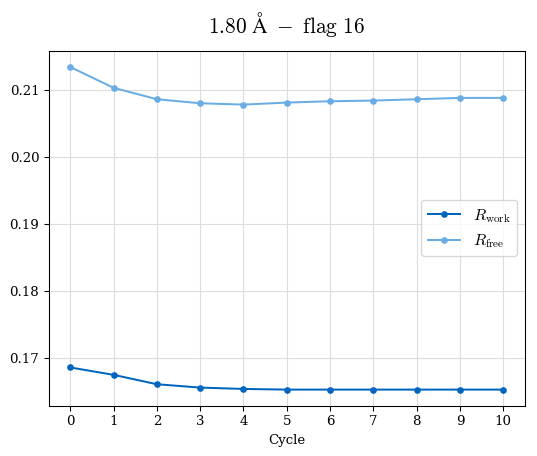
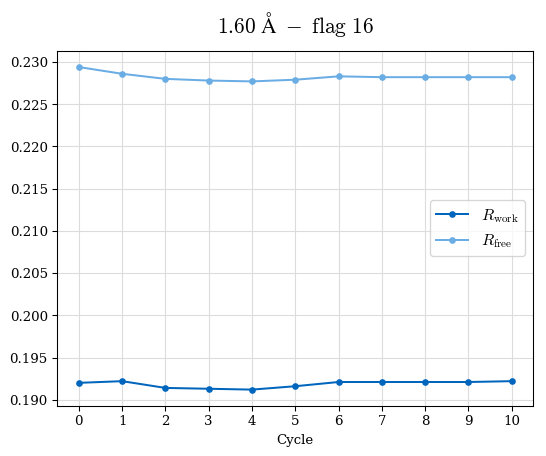
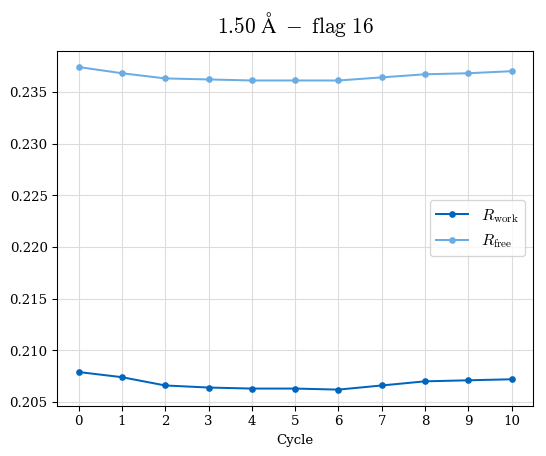
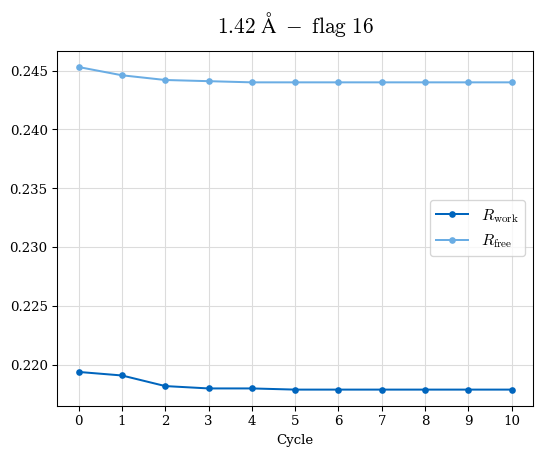
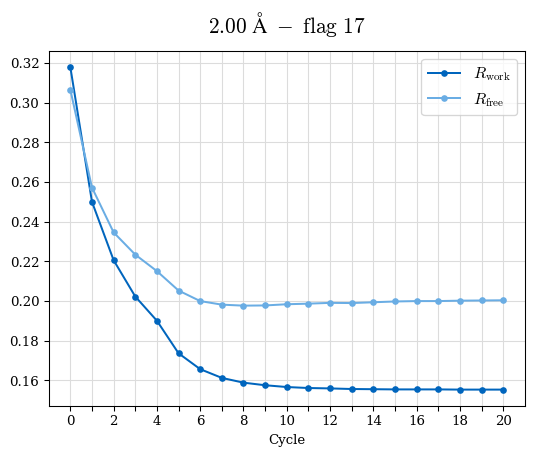
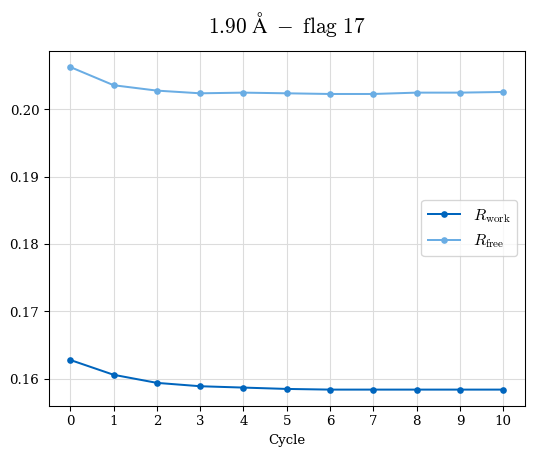
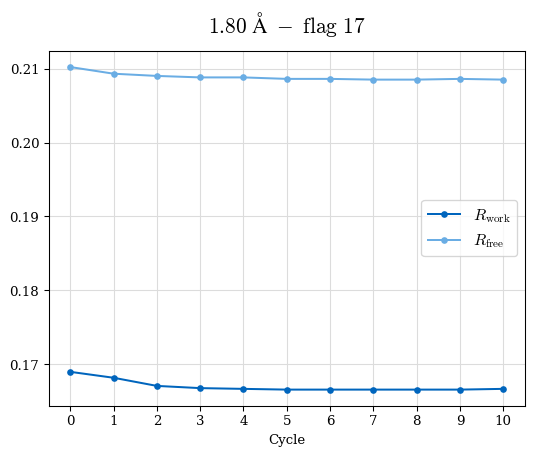
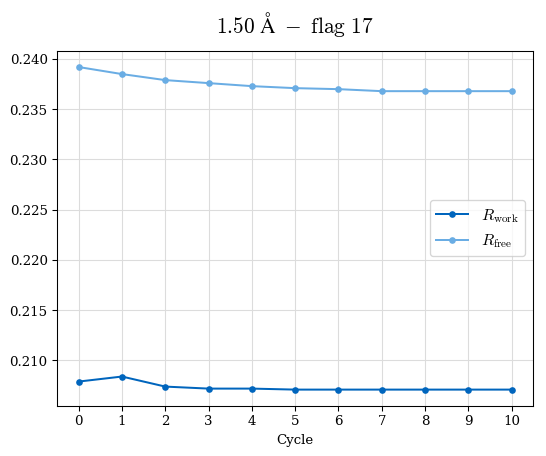
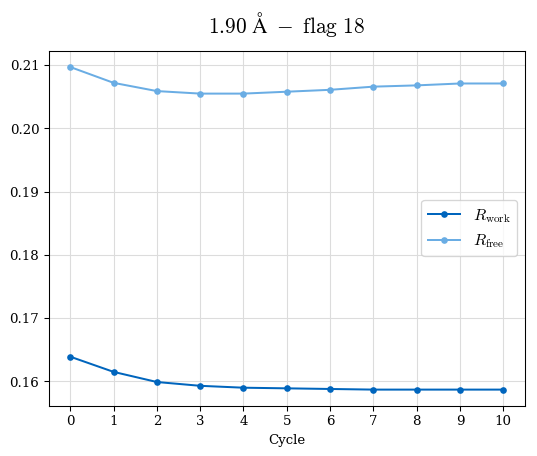
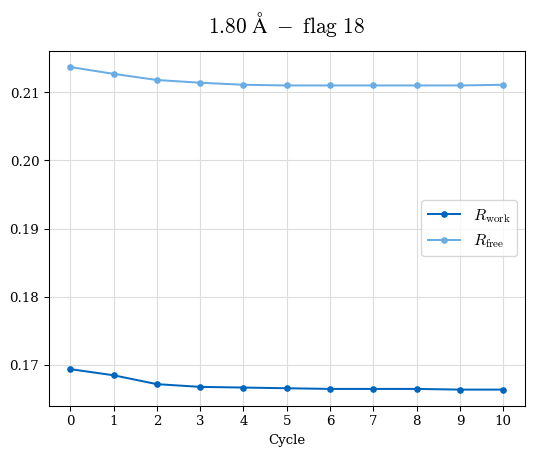
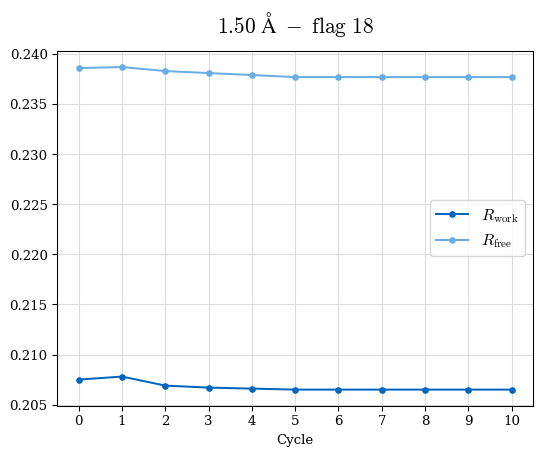
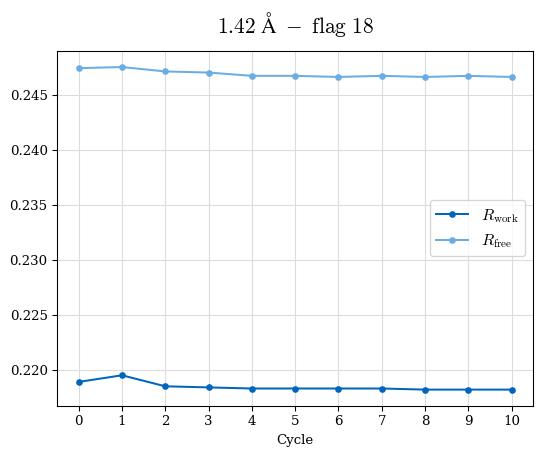
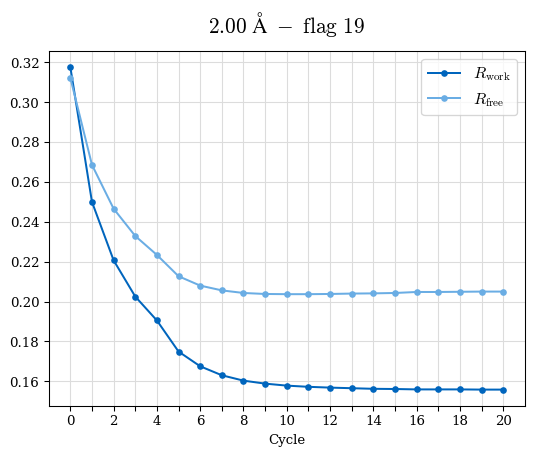
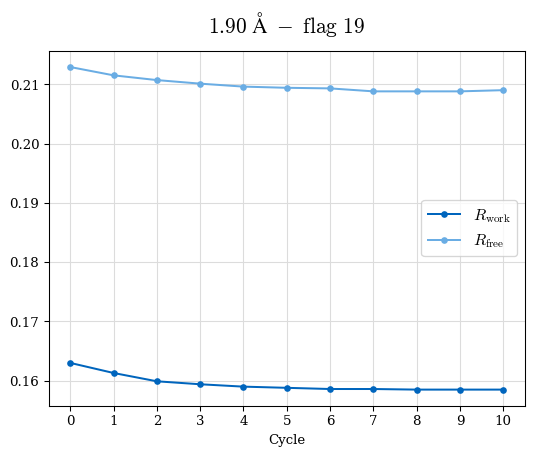
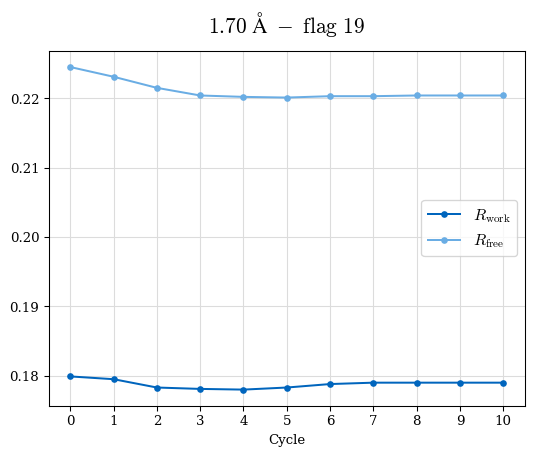
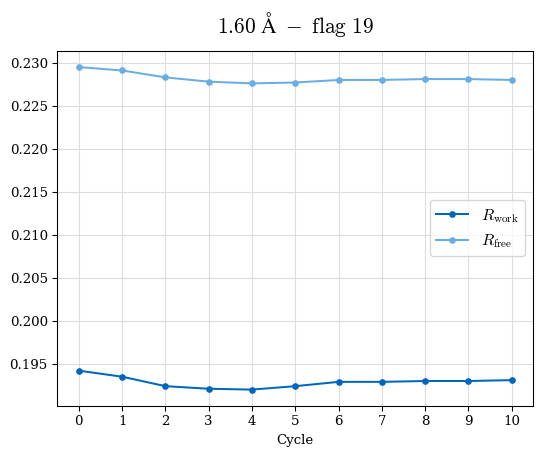
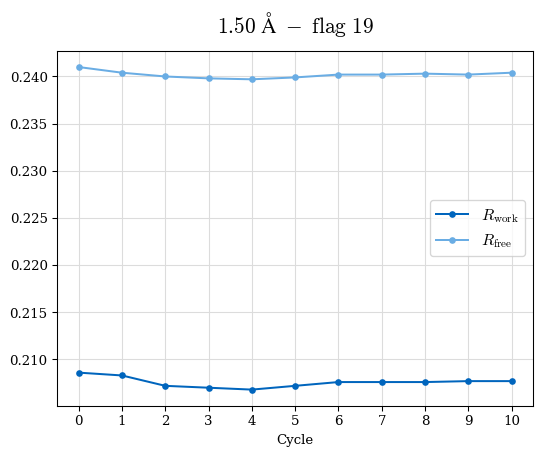
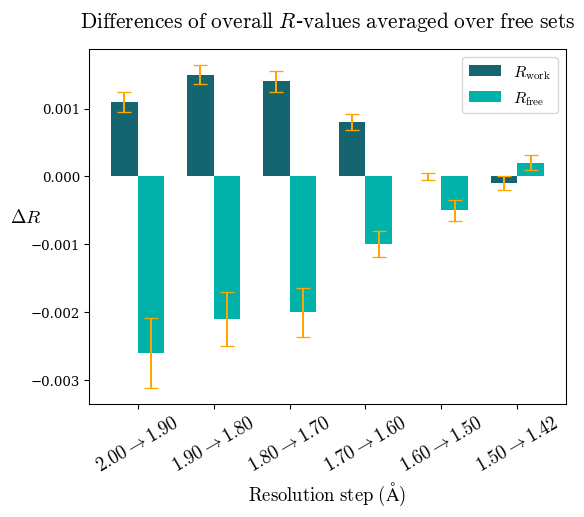
# Shell      Rwork(init) Rwork(fin) Rwork(diff)   Rfree(init) Rfree(fin) Rfree(diff)   Rwork(StDev)   Rfree(StDev)  Rwork(diff,SEM) Rfree(diff,SEM)
2.00A->1.90A      0.1555     0.1566      0.0011        0.2059     0.2033     -0.0026         0.0011       0.0076     0.00015       0.00051
1.90A->1.80A      0.1582     0.1598      0.0015        0.2050     0.2029     -0.0021         0.0005       0.0062     0.00014       0.0004
1.80A->1.70A      0.1663     0.1677      0.0014        0.2091     0.2070     -0.0020         0.0007       0.0058     0.00016       0.00036
1.70A->1.60A      0.1781     0.1789      0.0008        0.2161     0.2151     -0.0010         0.0006       0.0073     0.00012       0.00019
1.60A->1.50A      0.1925     0.1925      0.0000        0.2265     0.2261     -0.0005         0.0006       0.0072     5e-05       0.00016
1.50A->1.42A      0.2071     0.2070     -0.0001        0.2382     0.2384      0.0002         0.0005       0.0066     0.0001       0.00011

Note: For each incremental step of resolution from X->Y, the R-values were calculated at resolution X. Standard error of mean is shown in orange.

Rgap
Raw data: CDO_complete_Rgap.csv

Note: The R-values were calculated at 2.00 Å resolution.

R-values (complete cross-validation, 1.90 A) R-values (complete cross-validation, 1.80 A) R-values (complete cross-validation, 1.70 A) R-values (complete cross-validation, 1.60 A) R-values (complete cross-validation, 1.50 A) R-values (complete cross-validation, 1.42 A)

Merging statistics

CC Intensities Comp_Mult Rmerge_Rmeas_Rpim No_reflections

Raw data: CDO_complete_merging_stats.csv

#shell d_max  d_min   #obs  #uniq   mult.  %comp       <I>  <I/sI>    r_mrg   r_meas    r_pim   cc1/2   cc_ano     cc* 
01     41.96   3.98  30502   2013   15.15 100.00     509.9    92.4    0.029    0.030    0.008   1.000   0.444   1.0000
02      3.98   2.83  55734   3335   16.71 100.00     382.3    74.0    0.048    0.049    0.012   1.000   0.178   1.0000
03      2.83   2.31  73318   4261   17.21 100.00     152.2    40.9    0.127    0.131    0.031   0.999   0.046   0.9997
04      2.31   2.00  86730   5014   17.30 100.00     100.2    23.4    0.254    0.261    0.062   0.997   0.009   0.9992
05      2.00   1.90  40614   2360   17.21 100.00      60.5    13.0    0.412    0.425    0.101   0.993  -0.011   0.9982
06      1.90   1.80  48612   2886   16.84 100.00      31.9     6.8    0.577    0.595    0.144   0.976   0.015   0.9939
07      1.80   1.70  60936   3619   16.84 100.00      16.1     3.5    0.854    0.881    0.214   0.933   0.108   0.9825
08      1.70   1.60  65470   4548   14.40 100.00       8.9     1.9    1.251    1.297    0.340   0.783   0.144   0.9372
09      1.60   1.50  60309   5862   10.29 100.00       4.9     0.9    2.023    2.130    0.653   0.441  -0.021   0.7824
10      1.50   1.42  27549   5842    4.72  98.83       2.9     0.3    3.175    3.557    1.527   0.074   0.004   0.3712
		

Statistics vs. cycle

2.00A statistics vs. cycle, flag 00
Log file from refinement at 2.00 Å
Structure model refined at 2.00 Å PDB mmCIF
1.90A statistics vs. cycle, flag 00
Log file from refinement at 1.90 Å
Structure model refined at 1.90 Å PDB mmCIF
1.80A statistics vs. cycle, flag 00
Log file from refinement at 1.80 Å
Structure model refined at 1.80 Å PDB mmCIF
1.70A statistics vs. cycle, flag 00
Log file from refinement at 1.70 Å
Structure model refined at 1.70 Å PDB mmCIF
1.60A statistics vs. cycle, flag 00
Log file from refinement at 1.60 Å
Structure model refined at 1.60 Å PDB mmCIF
1.50A statistics vs. cycle, flag 00
Log file from refinement at 1.50 Å
Structure model refined at 1.50 Å PDB mmCIF
1.42A statistics vs. cycle, flag 00
Log file from refinement at 1.42 Å
Structure model refined at 1.42 Å PDB mmCIF
2.00A statistics vs. cycle, flag 01
Log file from refinement at 2.00 Å
Structure model refined at 2.00 Å PDB mmCIF
1.90A statistics vs. cycle, flag 01
Log file from refinement at 1.90 Å
Structure model refined at 1.90 Å PDB mmCIF
1.80A statistics vs. cycle, flag 01
Log file from refinement at 1.80 Å
Structure model refined at 1.80 Å PDB mmCIF
1.70A statistics vs. cycle, flag 01
Log file from refinement at 1.70 Å
Structure model refined at 1.70 Å PDB mmCIF
1.60A statistics vs. cycle, flag 01
Log file from refinement at 1.60 Å
Structure model refined at 1.60 Å PDB mmCIF
1.50A statistics vs. cycle, flag 01
Log file from refinement at 1.50 Å
Structure model refined at 1.50 Å PDB mmCIF
1.42A statistics vs. cycle, flag 01
Log file from refinement at 1.42 Å
Structure model refined at 1.42 Å PDB mmCIF
2.00A statistics vs. cycle, flag 02
Log file from refinement at 2.00 Å
Structure model refined at 2.00 Å PDB mmCIF
1.90A statistics vs. cycle, flag 02
Log file from refinement at 1.90 Å
Structure model refined at 1.90 Å PDB mmCIF
1.80A statistics vs. cycle, flag 02
Log file from refinement at 1.80 Å
Structure model refined at 1.80 Å PDB mmCIF
1.70A statistics vs. cycle, flag 02
Log file from refinement at 1.70 Å
Structure model refined at 1.70 Å PDB mmCIF
1.60A statistics vs. cycle, flag 02
Log file from refinement at 1.60 Å
Structure model refined at 1.60 Å PDB mmCIF
1.50A statistics vs. cycle, flag 02
Log file from refinement at 1.50 Å
Structure model refined at 1.50 Å PDB mmCIF
1.42A statistics vs. cycle, flag 02
Log file from refinement at 1.42 Å
Structure model refined at 1.42 Å PDB mmCIF
2.00A statistics vs. cycle, flag 03
Log file from refinement at 2.00 Å
Structure model refined at 2.00 Å PDB mmCIF
1.90A statistics vs. cycle, flag 03
Log file from refinement at 1.90 Å
Structure model refined at 1.90 Å PDB mmCIF
1.80A statistics vs. cycle, flag 03
Log file from refinement at 1.80 Å
Structure model refined at 1.80 Å PDB mmCIF
1.70A statistics vs. cycle, flag 03
Log file from refinement at 1.70 Å
Structure model refined at 1.70 Å PDB mmCIF
1.60A statistics vs. cycle, flag 03
Log file from refinement at 1.60 Å
Structure model refined at 1.60 Å PDB mmCIF
1.50A statistics vs. cycle, flag 03
Log file from refinement at 1.50 Å
Structure model refined at 1.50 Å PDB mmCIF
1.42A statistics vs. cycle, flag 03
Log file from refinement at 1.42 Å
Structure model refined at 1.42 Å PDB mmCIF
2.00A statistics vs. cycle, flag 04
Log file from refinement at 2.00 Å
Structure model refined at 2.00 Å PDB mmCIF
1.90A statistics vs. cycle, flag 04
Log file from refinement at 1.90 Å
Structure model refined at 1.90 Å PDB mmCIF
1.80A statistics vs. cycle, flag 04
Log file from refinement at 1.80 Å
Structure model refined at 1.80 Å PDB mmCIF
1.70A statistics vs. cycle, flag 04
Log file from refinement at 1.70 Å
Structure model refined at 1.70 Å PDB mmCIF
1.60A statistics vs. cycle, flag 04
Log file from refinement at 1.60 Å
Structure model refined at 1.60 Å PDB mmCIF
1.50A statistics vs. cycle, flag 04
Log file from refinement at 1.50 Å
Structure model refined at 1.50 Å PDB mmCIF
1.42A statistics vs. cycle, flag 04
Log file from refinement at 1.42 Å
Structure model refined at 1.42 Å PDB mmCIF
2.00A statistics vs. cycle, flag 05
Log file from refinement at 2.00 Å
Structure model refined at 2.00 Å PDB mmCIF
1.90A statistics vs. cycle, flag 05
Log file from refinement at 1.90 Å
Structure model refined at 1.90 Å PDB mmCIF
1.80A statistics vs. cycle, flag 05
Log file from refinement at 1.80 Å
Structure model refined at 1.80 Å PDB mmCIF
1.70A statistics vs. cycle, flag 05
Log file from refinement at 1.70 Å
Structure model refined at 1.70 Å PDB mmCIF
1.60A statistics vs. cycle, flag 05
Log file from refinement at 1.60 Å
Structure model refined at 1.60 Å PDB mmCIF
1.50A statistics vs. cycle, flag 05
Log file from refinement at 1.50 Å
Structure model refined at 1.50 Å PDB mmCIF
1.42A statistics vs. cycle, flag 05
Log file from refinement at 1.42 Å
Structure model refined at 1.42 Å PDB mmCIF
2.00A statistics vs. cycle, flag 06
Log file from refinement at 2.00 Å
Structure model refined at 2.00 Å PDB mmCIF
1.90A statistics vs. cycle, flag 06
Log file from refinement at 1.90 Å
Structure model refined at 1.90 Å PDB mmCIF
1.80A statistics vs. cycle, flag 06
Log file from refinement at 1.80 Å
Structure model refined at 1.80 Å PDB mmCIF
1.70A statistics vs. cycle, flag 06
Log file from refinement at 1.70 Å
Structure model refined at 1.70 Å PDB mmCIF
1.60A statistics vs. cycle, flag 06
Log file from refinement at 1.60 Å
Structure model refined at 1.60 Å PDB mmCIF
1.50A statistics vs. cycle, flag 06
Log file from refinement at 1.50 Å
Structure model refined at 1.50 Å PDB mmCIF
1.42A statistics vs. cycle, flag 06
Log file from refinement at 1.42 Å
Structure model refined at 1.42 Å PDB mmCIF
2.00A statistics vs. cycle, flag 07
Log file from refinement at 2.00 Å
Structure model refined at 2.00 Å PDB mmCIF
1.90A statistics vs. cycle, flag 07
Log file from refinement at 1.90 Å
Structure model refined at 1.90 Å PDB mmCIF
1.80A statistics vs. cycle, flag 07
Log file from refinement at 1.80 Å
Structure model refined at 1.80 Å PDB mmCIF
1.70A statistics vs. cycle, flag 07
Log file from refinement at 1.70 Å
Structure model refined at 1.70 Å PDB mmCIF
1.60A statistics vs. cycle, flag 07
Log file from refinement at 1.60 Å
Structure model refined at 1.60 Å PDB mmCIF
1.50A statistics vs. cycle, flag 07
Log file from refinement at 1.50 Å
Structure model refined at 1.50 Å PDB mmCIF
1.42A statistics vs. cycle, flag 07
Log file from refinement at 1.42 Å
Structure model refined at 1.42 Å PDB mmCIF
2.00A statistics vs. cycle, flag 08
Log file from refinement at 2.00 Å
Structure model refined at 2.00 Å PDB mmCIF
1.90A statistics vs. cycle, flag 08
Log file from refinement at 1.90 Å
Structure model refined at 1.90 Å PDB mmCIF
1.80A statistics vs. cycle, flag 08
Log file from refinement at 1.80 Å
Structure model refined at 1.80 Å PDB mmCIF
1.70A statistics vs. cycle, flag 08
Log file from refinement at 1.70 Å
Structure model refined at 1.70 Å PDB mmCIF
1.60A statistics vs. cycle, flag 08
Log file from refinement at 1.60 Å
Structure model refined at 1.60 Å PDB mmCIF
1.50A statistics vs. cycle, flag 08
Log file from refinement at 1.50 Å
Structure model refined at 1.50 Å PDB mmCIF
1.42A statistics vs. cycle, flag 08
Log file from refinement at 1.42 Å
Structure model refined at 1.42 Å PDB mmCIF
2.00A statistics vs. cycle, flag 09
Log file from refinement at 2.00 Å
Structure model refined at 2.00 Å PDB mmCIF
1.90A statistics vs. cycle, flag 09
Log file from refinement at 1.90 Å
Structure model refined at 1.90 Å PDB mmCIF
1.80A statistics vs. cycle, flag 09
Log file from refinement at 1.80 Å
Structure model refined at 1.80 Å PDB mmCIF
1.70A statistics vs. cycle, flag 09
Log file from refinement at 1.70 Å
Structure model refined at 1.70 Å PDB mmCIF
1.60A statistics vs. cycle, flag 09
Log file from refinement at 1.60 Å
Structure model refined at 1.60 Å PDB mmCIF
1.50A statistics vs. cycle, flag 09
Log file from refinement at 1.50 Å
Structure model refined at 1.50 Å PDB mmCIF
1.42A statistics vs. cycle, flag 09
Log file from refinement at 1.42 Å
Structure model refined at 1.42 Å PDB mmCIF
2.00A statistics vs. cycle, flag 10
Log file from refinement at 2.00 Å
Structure model refined at 2.00 Å PDB mmCIF
1.90A statistics vs. cycle, flag 10
Log file from refinement at 1.90 Å
Structure model refined at 1.90 Å PDB mmCIF
1.80A statistics vs. cycle, flag 10
Log file from refinement at 1.80 Å
Structure model refined at 1.80 Å PDB mmCIF
1.70A statistics vs. cycle, flag 10
Log file from refinement at 1.70 Å
Structure model refined at 1.70 Å PDB mmCIF
1.60A statistics vs. cycle, flag 10
Log file from refinement at 1.60 Å
Structure model refined at 1.60 Å PDB mmCIF
1.50A statistics vs. cycle, flag 10
Log file from refinement at 1.50 Å
Structure model refined at 1.50 Å PDB mmCIF
1.42A statistics vs. cycle, flag 10
Log file from refinement at 1.42 Å
Structure model refined at 1.42 Å PDB mmCIF
2.00A statistics vs. cycle, flag 11
Log file from refinement at 2.00 Å
Structure model refined at 2.00 Å PDB mmCIF
1.90A statistics vs. cycle, flag 11
Log file from refinement at 1.90 Å
Structure model refined at 1.90 Å PDB mmCIF
1.80A statistics vs. cycle, flag 11
Log file from refinement at 1.80 Å
Structure model refined at 1.80 Å PDB mmCIF
1.70A statistics vs. cycle, flag 11
Log file from refinement at 1.70 Å
Structure model refined at 1.70 Å PDB mmCIF
1.60A statistics vs. cycle, flag 11
Log file from refinement at 1.60 Å
Structure model refined at 1.60 Å PDB mmCIF
1.50A statistics vs. cycle, flag 11
Log file from refinement at 1.50 Å
Structure model refined at 1.50 Å PDB mmCIF
1.42A statistics vs. cycle, flag 11
Log file from refinement at 1.42 Å
Structure model refined at 1.42 Å PDB mmCIF
2.00A statistics vs. cycle, flag 12
Log file from refinement at 2.00 Å
Structure model refined at 2.00 Å PDB mmCIF
1.90A statistics vs. cycle, flag 12
Log file from refinement at 1.90 Å
Structure model refined at 1.90 Å PDB mmCIF
1.80A statistics vs. cycle, flag 12
Log file from refinement at 1.80 Å
Structure model refined at 1.80 Å PDB mmCIF
1.70A statistics vs. cycle, flag 12
Log file from refinement at 1.70 Å
Structure model refined at 1.70 Å PDB mmCIF
1.60A statistics vs. cycle, flag 12
Log file from refinement at 1.60 Å
Structure model refined at 1.60 Å PDB mmCIF
1.50A statistics vs. cycle, flag 12
Log file from refinement at 1.50 Å
Structure model refined at 1.50 Å PDB mmCIF
1.42A statistics vs. cycle, flag 12
Log file from refinement at 1.42 Å
Structure model refined at 1.42 Å PDB mmCIF
2.00A statistics vs. cycle, flag 13
Log file from refinement at 2.00 Å
Structure model refined at 2.00 Å PDB mmCIF
1.90A statistics vs. cycle, flag 13
Log file from refinement at 1.90 Å
Structure model refined at 1.90 Å PDB mmCIF
1.80A statistics vs. cycle, flag 13
Log file from refinement at 1.80 Å
Structure model refined at 1.80 Å PDB mmCIF
1.70A statistics vs. cycle, flag 13
Log file from refinement at 1.70 Å
Structure model refined at 1.70 Å PDB mmCIF
1.60A statistics vs. cycle, flag 13
Log file from refinement at 1.60 Å
Structure model refined at 1.60 Å PDB mmCIF
1.50A statistics vs. cycle, flag 13
Log file from refinement at 1.50 Å
Structure model refined at 1.50 Å PDB mmCIF
1.42A statistics vs. cycle, flag 13
Log file from refinement at 1.42 Å
Structure model refined at 1.42 Å PDB mmCIF
2.00A statistics vs. cycle, flag 14
Log file from refinement at 2.00 Å
Structure model refined at 2.00 Å PDB mmCIF
1.90A statistics vs. cycle, flag 14
Log file from refinement at 1.90 Å
Structure model refined at 1.90 Å PDB mmCIF
1.80A statistics vs. cycle, flag 14
Log file from refinement at 1.80 Å
Structure model refined at 1.80 Å PDB mmCIF
1.70A statistics vs. cycle, flag 14
Log file from refinement at 1.70 Å
Structure model refined at 1.70 Å PDB mmCIF
1.60A statistics vs. cycle, flag 14
Log file from refinement at 1.60 Å
Structure model refined at 1.60 Å PDB mmCIF
1.50A statistics vs. cycle, flag 14
Log file from refinement at 1.50 Å
Structure model refined at 1.50 Å PDB mmCIF
1.42A statistics vs. cycle, flag 14
Log file from refinement at 1.42 Å
Structure model refined at 1.42 Å PDB mmCIF
2.00A statistics vs. cycle, flag 15
Log file from refinement at 2.00 Å
Structure model refined at 2.00 Å PDB mmCIF
1.90A statistics vs. cycle, flag 15
Log file from refinement at 1.90 Å
Structure model refined at 1.90 Å PDB mmCIF
1.80A statistics vs. cycle, flag 15
Log file from refinement at 1.80 Å
Structure model refined at 1.80 Å PDB mmCIF
1.70A statistics vs. cycle, flag 15
Log file from refinement at 1.70 Å
Structure model refined at 1.70 Å PDB mmCIF
1.60A statistics vs. cycle, flag 15
Log file from refinement at 1.60 Å
Structure model refined at 1.60 Å PDB mmCIF
1.50A statistics vs. cycle, flag 15
Log file from refinement at 1.50 Å
Structure model refined at 1.50 Å PDB mmCIF
1.42A statistics vs. cycle, flag 15
Log file from refinement at 1.42 Å
Structure model refined at 1.42 Å PDB mmCIF
2.00A statistics vs. cycle, flag 16
Log file from refinement at 2.00 Å
Structure model refined at 2.00 Å PDB mmCIF
1.90A statistics vs. cycle, flag 16
Log file from refinement at 1.90 Å
Structure model refined at 1.90 Å PDB mmCIF
1.80A statistics vs. cycle, flag 16
Log file from refinement at 1.80 Å
Structure model refined at 1.80 Å PDB mmCIF
1.70A statistics vs. cycle, flag 16
Log file from refinement at 1.70 Å
Structure model refined at 1.70 Å PDB mmCIF
1.60A statistics vs. cycle, flag 16
Log file from refinement at 1.60 Å
Structure model refined at 1.60 Å PDB mmCIF
1.50A statistics vs. cycle, flag 16
Log file from refinement at 1.50 Å
Structure model refined at 1.50 Å PDB mmCIF
1.42A statistics vs. cycle, flag 16
Log file from refinement at 1.42 Å
Structure model refined at 1.42 Å PDB mmCIF
2.00A statistics vs. cycle, flag 17
Log file from refinement at 2.00 Å
Structure model refined at 2.00 Å PDB mmCIF
1.90A statistics vs. cycle, flag 17
Log file from refinement at 1.90 Å
Structure model refined at 1.90 Å PDB mmCIF
1.80A statistics vs. cycle, flag 17
Log file from refinement at 1.80 Å
Structure model refined at 1.80 Å PDB mmCIF
1.70A statistics vs. cycle, flag 17
Log file from refinement at 1.70 Å
Structure model refined at 1.70 Å PDB mmCIF
1.60A statistics vs. cycle, flag 17
Log file from refinement at 1.60 Å
Structure model refined at 1.60 Å PDB mmCIF
1.50A statistics vs. cycle, flag 17
Log file from refinement at 1.50 Å
Structure model refined at 1.50 Å PDB mmCIF
1.42A statistics vs. cycle, flag 17
Log file from refinement at 1.42 Å
Structure model refined at 1.42 Å PDB mmCIF
2.00A statistics vs. cycle, flag 18
Log file from refinement at 2.00 Å
Structure model refined at 2.00 Å PDB mmCIF
1.90A statistics vs. cycle, flag 18
Log file from refinement at 1.90 Å
Structure model refined at 1.90 Å PDB mmCIF
1.80A statistics vs. cycle, flag 18
Log file from refinement at 1.80 Å
Structure model refined at 1.80 Å PDB mmCIF
1.70A statistics vs. cycle, flag 18
Log file from refinement at 1.70 Å
Structure model refined at 1.70 Å PDB mmCIF
1.60A statistics vs. cycle, flag 18
Log file from refinement at 1.60 Å
Structure model refined at 1.60 Å PDB mmCIF
1.50A statistics vs. cycle, flag 18
Log file from refinement at 1.50 Å
Structure model refined at 1.50 Å PDB mmCIF
1.42A statistics vs. cycle, flag 18
Log file from refinement at 1.42 Å
Structure model refined at 1.42 Å PDB mmCIF
2.00A statistics vs. cycle, flag 19
Log file from refinement at 2.00 Å
Structure model refined at 2.00 Å PDB mmCIF
1.90A statistics vs. cycle, flag 19
Log file from refinement at 1.90 Å
Structure model refined at 1.90 Å PDB mmCIF
1.80A statistics vs. cycle, flag 19
Log file from refinement at 1.80 Å
Structure model refined at 1.80 Å PDB mmCIF
1.70A statistics vs. cycle, flag 19
Log file from refinement at 1.70 Å
Structure model refined at 1.70 Å PDB mmCIF
1.60A statistics vs. cycle, flag 19
Log file from refinement at 1.60 Å
Structure model refined at 1.60 Å PDB mmCIF
1.50A statistics vs. cycle, flag 19
Log file from refinement at 1.50 Å
Structure model refined at 1.50 Å PDB mmCIF
1.42A statistics vs. cycle, flag 19
Log file from refinement at 1.42 Å
Structure model refined at 1.42 Å PDB mmCIF

References

Please reference the used software: